
A Guide on RSI Trading Strategy
- Amman Kumar
- Mar 22, 2025
- 4 min read

Trading can be tough, especially when markets move unpredictably.
But what if there was a tool that helped you spot trend reversals, time your trades better, and reduce risks? The Relative Strength Index (RSI) trading strategy does just that.
Developed by J. Welles Wilder Jr., RSI is a momentum indicator that traders use in stocks, forex, and cryptocurrency markets. It helps identify overbought and oversold conditions, giving you better trade entry and exit points.
What is RSI?

The Relative Strength Index (RSI) is a tool that measures how fast prices are moving up or down. It ranges from 0 to 100 and helps traders decide when an asset is too expensive (overbought) or too cheap (oversold).
Overbought (Above 70): The price has risen too fast and might drop soon.
Oversold (Below 30): The price has fallen too much and might go up soon.
By watching RSI levels, traders can predict potential trend changes and avoid bad trades.
How to Use RSI in Trading?

Spot Overbought and Oversold Levels
Buy when RSI falls below 30 and starts rising.
Sell when RSI goes above 70 and starts falling.
Look for RSI Divergence
Bullish Divergence: Price makes a lower low, but RSI makes a higher low → Possible uptrend.
Bearish Divergence: Price makes a higher high, but RSI makes a lower high → Possible downtrend.
Advanced RSI Trading Strategies
RSI with Moving Averages
Use RSI and a moving average (50-day or 200-day) to confirm trends.
If RSI is overbought but price is above the moving average, wait for more confirmation before selling.
RSI Swing Trading Strategy
Instead of using 30 and 70, some traders set RSI levels at 40 and 60 to catch trends earlier.
If RSI moves from 40 to 60, it shows strength, signaling a good trade opportunity.
RSI Trendline Breakouts
Draw trendlines directly on the RSI chart to detect trend shifts before price moves.
If RSI breaks its trendline before the price chart does, it signals an early trend change.
Best RSI Settings for Different Markets

Stock Market
14-period RSI is the standard setting.
Short-term traders use 5-period RSI for quicker signals.
Forex Market
9-period RSI is common for fast currency moves.
Some traders prefer 21-period RSI for stable signals.
Cryptocurrency Trading
Crypto markets are highly volatile, so traders use 7 or 10-period RSI for faster signals.
Common RSI Trading Mistakes

Relying Only on RSI
RSI is not perfect—always use it with trendlines, moving averages, or price action for better results.
Ignoring Market Trends
RSI can stay overbought or oversold for a long time in strong trends. Wait for clear trend reversals before making a trade.
Not Adjusting RSI Settings
Different markets need different RSI settings. Adjust your RSI period depending on market conditions.
Combining RSI with Other Indicators
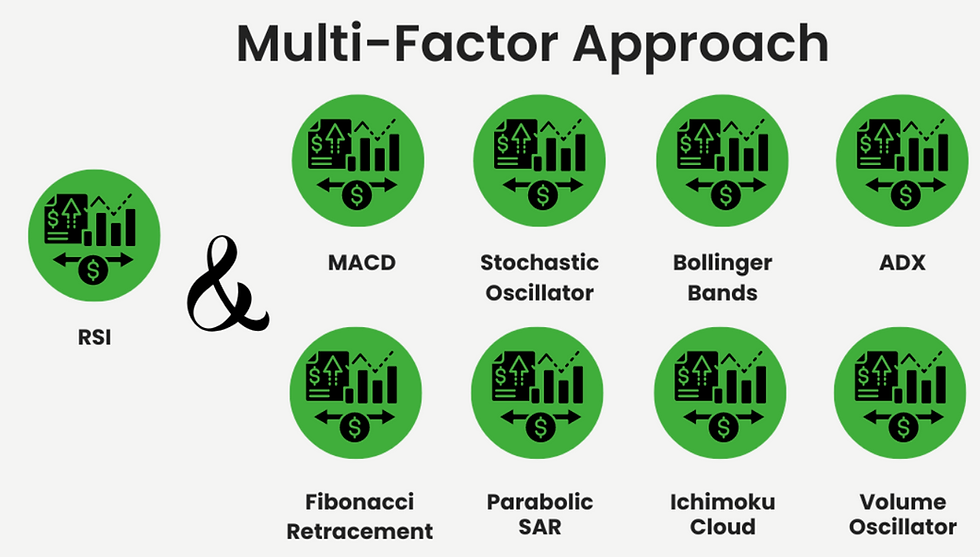
RSI and MACD
RSI finds overbought/oversold areas, while MACD confirms trend direction.
If RSI is below 30 and MACD crosses up, it’s a strong buy signal.
RSI and Bollinger Bands
If RSI is oversold and price touches the lower Bollinger Band, it’s a buy signal.
If RSI is overbought and price touches the upper Bollinger Band, it’s a sell signal.
Real-Life Example of RSI Trading Strategy

Let’s say you’re watching a stock that has been moving upwards.
The stock hits 100, and RSI reaches 75 → Overbought signal. A few days later, the stock drops to $90, and RSI falls to 50 → Possible pullback. If RSI falls to 30 and starts rising again, it’s a good time to buy.
By using RSI wisely, you can avoid buying at the peak and enter at a better price.
Final Thoughts:
The RSI trading strategy is a great tool for finding overbought and oversold conditions, trend reversals, and trade opportunities. However, no single indicator is perfect.
To get the best results, combine RSI with price action, moving averages, MACD, and trendlines. With the right settings and a solid strategy, RSI can help traders reduce risks and improve profits.
FAQS
What is the best RSI setting for day trading?
The 9-period RSI is commonly used for day trading because it gives faster signals. Some traders prefer 14-period RSI for better accuracy.
Can RSI be used for long-term investing?
Yes! RSI can be used on weekly or monthly charts to find long-term entry points.
How do you confirm RSI signals?
RSI signals should be confirmed using price action, trendlines, moving averages, MACD, or Bollinger Bands.
Is RSI reliable in a strong trend?
Not always. In strong trends, RSI can stay overbought or oversold for a long time. That’s why traders use trend confirmation before making decisions.
Can RSI be used for crypto trading?
Yes, but because crypto is highly volatile, traders use shorter RSI periods (7 or 10-period RSI) for faster signals.
What is RSI divergence?
RSI divergence happens when the price moves in one direction and RSI moves in the opposite.
Bullish divergence signals an uptrend.
Bearish divergence signals a downtrend.
By understanding RSI divergence, traders can catch trend reversals early.


This post really hit home. Position sizing saved my capital.
Great addition to my trading tools!
Could you do a video walkthrough for beginners?
The Supertrend + MA combo sounds interesting.
Can’t wait to test this out. Bookmarked!