
What is Bollinger Bands and How to Use it in Trading
- Amman Kumar
- Mar 13, 2025
- 4 min read

Trading in financial markets requires tools that help traders make better decisions. One such tool is Bollinger Bands, a technical indicator that helps traders understand market trends, spot opportunities, and manage risks.
Created by John Bollinger, this tool is widely used in stock, forex, and cryptocurrency markets.
In this article, we will explore how Bollinger Bands work, how to use them in trading, and some common strategies that traders apply to maximize their profits.
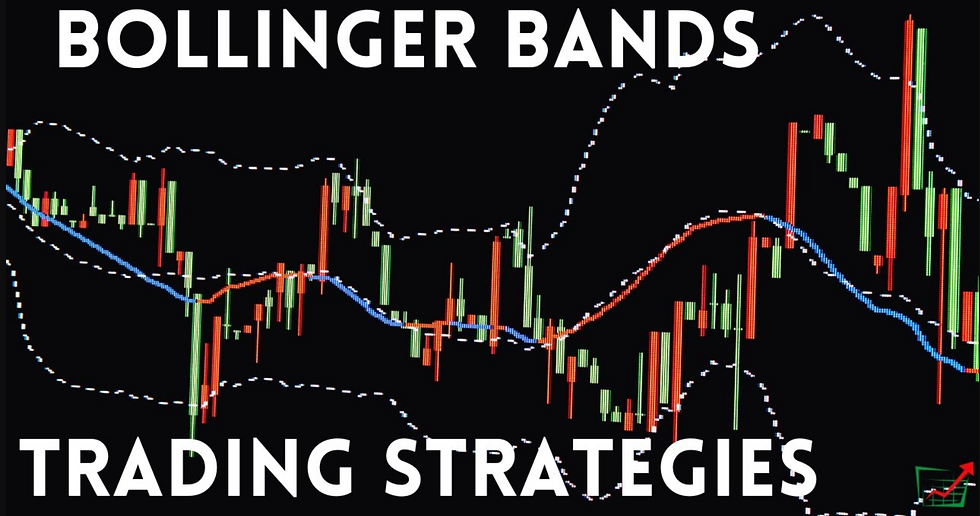
What Are Bollinger Bands
Bollinger Bands are a technical indicator that helps traders analyze price movements and market volatility. They consist of three main components:
The Three Components of Bollinger Bands

Middle Band
The middle band is a simple moving average (SMA), typically set to 20 periods. It shows the average price over a certain number of days and acts as the centerline of the indicator.
Upper Band
The upper band is set two standard deviations above the middle band. It represents the higher range of price movement and helps identify overbought conditions.
Lower Band
The lower band is set two standard deviations below the middle band. It represents the lower range of price movement and helps identify oversold conditions.
How Bollinger Bands Work

Bollinger Bands change based on market volatility. When the market is highly volatile, the bands widen. When the market is calm, the bands contract.
When prices move close to the upper band, the asset may be overbought, meaning prices could fall soon.
When prices move close to the lower band, the asset may be oversold, meaning prices could rise soon.
Traders use these movements to predict price reversals and find trading opportunities.
How to Use Bollinger Bands in Trading

Bollinger Bands can be used in different ways to analyze the market and make informed trading decisions.
Identifying Overbought and Oversold Conditions
When the price touches or moves above the upper band, it may indicate that the asset is overbought, and a price drop could happen. Similarly, when the price touches or moves below the lower band, it may indicate that the asset is oversold, and a price increase could follow.
Detecting Market Trends
When the bands widen, it means that volatility is increasing. This usually happens before big price movements.
When the bands contract, it indicates low volatility, often before a major price breakout.
Using the Bollinger Band Squeeze Strategy
A Bollinger Band squeeze happens when the bands come very close together. This signals that the market is in a low volatility phase and could soon experience a sharp move in either direction. Traders prepare for breakouts by watching for price movements outside the bands.
Using Bollinger Bands with Other Indicators
Bollinger Bands work best when used with other technical indicators such as:
Relative Strength Index (RSI): Helps confirm overbought or oversold conditions.
Moving Averages: Helps determine the overall trend direction.
MACD (Moving Average Convergence Divergence): Helps identify trend changes and momentum.
Common Bollinger Band Trading Strategies
Bollinger Band Breakout Strategy
In this strategy, traders look for a breakout above the upper band or below the lower band. A breakout often signals a strong trend, and traders enter positions in the direction of the breakout.
Reversal Trading Strategy
Traders watch for price movements that touch or go beyond the upper or lower bands and wait for a reversal signal. This is useful for short-term traders looking for quick profits.
Riding the Trend with Bollinger Bands
When a strong uptrend occurs, the price will often stay close to the upper band. In a downtrend, the price will stay near the lower band. Traders can use this to follow the trend and ride the momentum.
Double Bottom and Double Top with Bollinger Bands
A double bottom forms when the price touches the lower band twice, indicating a potential reversal to the upside.
A double top forms when the price touches the upper band twice, signaling a possible drop in price.
Mistakes to Avoid When Using Bollinger Bands
Relying Only on Bollinger Bands
Bollinger Bands are a great tool, but they should not be used alone. Combining them with other indicators improves accuracy.
Ignoring Market Trends
Some traders use Bollinger Bands without considering the overall market trend. In a strong uptrend, prices may stay near the upper band without reversing. In a downtrend, prices may stay near the lower band.
Overtrading in Choppy Markets
During sideways markets, prices may move randomly between the bands, causing traders to make too many trades. It is important to wait for strong signals.
Misinterpreting Breakouts
A price breakout outside the bands does not always mean a new trend has started. Traders should look for confirmation signals before entering a trade.
Final Thoughts:
Bollinger Bands are a powerful tool that helps traders understand market trends, find trading opportunities, and manage risks. By using overbought and oversold signals, breakouts, and volatility patterns, traders can make better trading decisions.
However, Bollinger Bands should not be used alone. They work best when combined with other indicators and a solid trading plan. Whether you are a beginner or an experienced trader, mastering Bollinger Bands can improve your market analysis and boost your trading success.
FAQs
What are Bollinger Bands used for in trading?
Bollinger Bands are used to analyze market trends, identify overbought and oversold conditions, and detect potential price breakouts.
How do Bollinger Bands indicate market volatility?
When the bands widen, it shows high volatility. When the bands contract, it means low volatility, often before a major price move.
Can Bollinger Bands be used in all types of trading?
Yes, Bollinger Bands can be used in stocks, forex, cryptocurrency, and commodity trading. They are effective in both short-term and long-term strategies.
What is the Bollinger Band squeeze?
A Bollinger Band squeeze happens when the bands come very close together, signaling low volatility and a possible upcoming price breakout.
Do Bollinger Bands work alone?
No, Bollinger Bands work best when combined with other indicators like RSI, MACD, or moving averages to improve accuracy.
Can beginners use Bollinger Bands?
Yes, beginners can use Bollinger Bands, but they should first learn how they work and practice with a demo account before using them in live trading.


I’ve seen gaps often but never knew how to trade them—this cleared things up, thank you!
Always wondered why these gaps happen. Thanks for clearing it up!
This is gold for anyone into algo trading.
Supertrend made easy! Thanks for the post.
I’ll definitely try the journaling idea you suggested.